Trending


Coronavirus wealth gap widens as NYC cases reaches plateau: TRD Insights
Testing and infection rates have risen faster in low-income neighborhoods

When New York City’s Department of Health first published ZIP code-level coronavirus testing data in early April, it was clear that the city’s poorer neighborhoods were bearing the brunt of the pandemic — a trend that has been observed across the country. In the two weeks since, as testing has ramped up and the epidemic curve has risen to an apparent plateau, the divide between low- and high-income neighborhoods has sharpened.
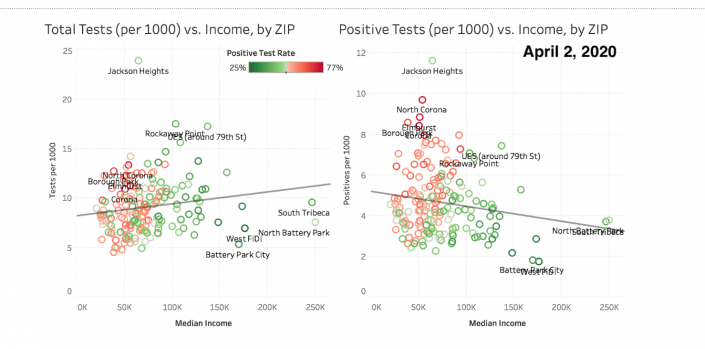
An analysis by The Real Deal of that testing data and U.S. Census Bureau population and income figures illustrates this shift. When the analysis was first performed April 2, it appeared that neighborhoods across the city were being tested for coronavirus at similar rates regardless of income, and that a higher proportion of tests were positive in low-income areas — notably Borough Park, Elmhurst and other hot spots.
Coronavirus testing by zip code as of April 2nd
| Zip Code | Positive Tests | Total Tests | Population | Median Income | Positive Rate |
|---|---|---|---|---|---|
| 10001 | 113 | 265 | 22,924 | $88,526 | 42.64% |
| 10002 | 250 | 542 | 74,993 | $35,859 | 46.13% |
| 10003 | 161 | 379 | 54,682 | $112,131 | 42.48% |
| 10004 | 16 | 38 | 3,028 | $157,645 | 42.11% |
| 10005 | 25 | 81 | 8,831 | $173,333 | 30.86% |
| 10006 | 6 | 24 | 3,454 | $176,250 | 25.00% |
| 10007 | 26 | 67 | 7,023 | $246,813 | 38.81% |
| 10009 | 181 | 450 | 57,925 | $61,548 | 40.22% |
| 10010 | 101 | 282 | 33,730 | $117,923 | 35.82% |
| 10011 | 222 | 487 | 50,472 | $128,613 | 45.59% |
| 10012 | 68 | 183 | 23,411 | $109,037 | 37.16% |
| 10013 | 122 | 255 | 28,709 | $105,442 | 47.84% |
| 10014 | 140 | 305 | 30,738 | $126,601 | 45.90% |
| 10016 | 288 | 581 | 51,057 | $117,004 | 49.57% |
| 10017 | 45 | 138 | 15,801 | $127,506 | 32.61% |
| 10018 | 66 | 151 | 9,687 | $108,914 | 43.71% |
| 10019 | 187 | 451 | 43,703 | $98,833 | 41.46% |
| 10021 | 211 | 562 | 46,215 | $118,289 | 37.54% |
| 10022 | 123 | 339 | 31,125 | $135,363 | 36.28% |
| 10023 | 190 | 503 | 62,435 | $130,452 | 37.77% |
| 10024 | 204 | 641 | 59,001 | $131,668 | 31.83% |
| 10025 | 252 | 754 | 92,805 | $85,930 | 33.42% |
| 10026 | 126 | 300 | 39,363 | $58,884 | 42.00% |
| 10027 | 170 | 422 | 64,548 | $46,113 | 40.28% |
| 10028 | 189 | 476 | 47,793 | $125,140 | 39.71% |
| 10029 | 290 | 668 | 79,597 | $34,016 | 43.41% |
| 10030 | 106 | 204 | 29,882 | $37,232 | 51.96% |
| 10031 | 217 | 405 | 60,254 | $49,891 | 53.58% |
| 10032 | 308 | 548 | 64,264 | $50,391 | 56.20% |
| 10033 | 264 | 495 | 59,607 | $58,614 | 53.33% |
| 10034 | 108 | 262 | 42,910 | $54,716 | 41.22% |
| 10035 | 147 | 345 | 35,743 | $30,081 | 42.61% |
| 10036 | 116 | 275 | 27,428 | $91,936 | 42.18% |
| 10037 | 109 | 204 | 21,139 | $45,041 | 53.43% |
| 10038 | 76 | 167 | 22,800 | $86,058 | 45.51% |
| 10039 | 116 | 226 | 27,726 | $39,653 | 51.33% |
| 10040 | 208 | 356 | 44,571 | $47,137 | 58.43% |
| 10065 | 121 | 385 | 28,109 | $127,375 | 31.43% |
| 10069 | 24 | 57 | 5,085 | $110,625 | 42.11% |
| 10075 | 160 | 371 | 21,556 | $137,146 | 43.13% |
| 10128 | 212 | 596 | 59,256 | $114,010 | 35.57% |
| 10280 | 17 | 50 | 9,384 | $169,844 | 34.00% |
| 10282 | 21 | 42 | 5,593 | $250,001 | 50.00% |
| 10301 | 175 | 333 | 38,733 | $55,802 | 52.55% |
| 10302 | 61 | 137 | 18,204 | $64,103 | 44.53% |
| 10303 | 106 | 221 | 25,947 | $62,558 | 47.96% |
| 10304 | 289 | 540 | 41,064 | $52,199 | 53.52% |
| 10305 | 178 | 428 | 42,298 | $76,489 | 41.59% |
| 10306 | 278 | 632 | 53,142 | $79,569 | 43.99% |
| 10307 | 67 | 142 | 15,232 | $80,893 | 47.18% |
| 10308 | 146 | 331 | 30,186 | $93,963 | 44.11% |
| 10309 | 170 | 363 | 33,531 | $103,175 | 46.83% |
| 10310 | 97 | 218 | 23,262 | $72,093 | 44.50% |
| 10312 | 336 | 654 | 61,741 | $95,064 | 51.38% |
| 10314 | 452 | 959 | 90,761 | $86,742 | 47.13% |
| 10451 | 337 | 585 | 47,798 | $28,921 | 57.61% |
| 10452 | 367 | 629 | 76,078 | $28,277 | 58.35% |
| 10453 | 386 | 663 | 79,606 | $25,275 | 58.22% |
| 10454 | 174 | 343 | 38,203 | $21,149 | 50.73% |
| 10455 | 176 | 351 | 42,283 | $26,801 | 50.14% |
| 10456 | 355 | 693 | 94,218 | $27,106 | 51.23% |
| 10457 | 306 | 571 | 74,554 | $27,420 | 53.59% |
| 10458 | 332 | 622 | 83,960 | $33,932 | 53.38% |
| 10459 | 227 | 423 | 48,351 | $27,687 | 53.66% |
| 10460 | 255 | 484 | 59,505 | $26,866 | 52.69% |
| 10461 | 376 | 714 | 50,348 | $56,612 | 52.66% |
| 10462 | 377 | 768 | 76,756 | $52,409 | 49.09% |
| 10463 | 253 | 654 | 71,360 | $58,551 | 38.69% |
| 10464 | 25 | 65 | 4,434 | $93,365 | 38.46% |
| 10465 | 267 | 596 | 44,205 | $74,796 | 44.80% |
| 10466 | 362 | 666 | 72,479 | $51,477 | 54.35% |
| 10467 | 638 | 1134 | 103,732 | $37,015 | 56.26% |
| 10468 | 397 | 624 | 78,647 | $36,046 | 63.62% |
| 10469 | 470 | 815 | 73,870 | $63,652 | 57.67% |
| 10470 | 83 | 157 | 15,432 | $57,160 | 52.87% |
| 10471 | 104 | 297 | 21,896 | $85,707 | 35.02% |
| 10472 | 302 | 528 | 68,796 | $30,977 | 57.20% |
| 10473 | 304 | 556 | 59,609 | $41,638 | 54.68% |
| 10474 | 55 | 97 | 12,127 | $25,493 | 56.70% |
| 10475 | 255 | 446 | 43,208 | $50,832 | 57.17% |
| 11429 | 163 | 265 | 27,403 | $83,240 | 61.51% |
| 11004 | 121 | 204 | 15,234 | $92,657 | 59.31% |
| 11101 | 148 | 320 | 30,043 | $65,392 | 46.25% |
| 11102 | 105 | 231 | 30,800 | $64,067 | 45.45% |
| 11103 | 104 | 203 | 36,140 | $71,437 | 51.23% |
| 11104 | 85 | 155 | 26,119 | $61,269 | 54.84% |
| 11105 | 104 | 242 | 37,382 | $73,959 | 42.98% |
| 11106 | 144 | 290 | 38,363 | $63,703 | 49.66% |
| 11109 | 13 | 45 | 5,981 | $148,590 | 28.89% |
| 11201 | 204 | 479 | 62,823 | $124,996 | 42.59% |
| 11203 | 343 | 546 | 75,451 | $51,277 | 62.82% |
| 11204 | 534 | 932 | 76,978 | $49,785 | 57.30% |
| 11205 | 182 | 319 | 46,064 | $56,708 | 57.05% |
| 11206 | 329 | 572 | 88,349 | $36,404 | 57.52% |
| 11207 | 332 | 587 | 91,972 | $37,243 | 56.56% |
| 11208 | 350 | 561 | 98,660 | $40,733 | 62.39% |
| 11209 | 209 | 452 | 67,809 | $72,314 | 46.24% |
| 11210 | 386 | 671 | 67,040 | $65,900 | 57.53% |
| 11211 | 601 | 961 | 102,624 | $71,225 | 62.54% |
| 11212 | 254 | 445 | 76,527 | $26,239 | 57.08% |
| 11213 | 394 | 621 | 66,295 | $41,710 | 63.45% |
| 11214 | 251 | 544 | 92,946 | $54,041 | 46.14% |
| 11215 | 178 | 437 | 70,156 | $123,583 | 40.73% |
| 11216 | 162 | 316 | 56,308 | $61,121 | 51.27% |
| 11217 | 130 | 269 | 41,407 | $107,362 | 48.33% |
| 11218 | 350 | 613 | 74,508 | $69,415 | 57.10% |
| 11219 | 771 | 1146 | 90,036 | $39,295 | 67.28% |
| 11220 | 264 | 459 | 95,643 | $47,079 | 57.52% |
| 11221 | 260 | 455 | 83,835 | $50,153 | 57.14% |
| 11222 | 96 | 236 | 36,492 | $85,111 | 40.68% |
| 11223 | 346 | 642 | 81,789 | $50,108 | 53.89% |
| 11224 | 133 | 304 | 46,707 | $33,131 | 43.75% |
| 11225 | 267 | 427 | 58,882 | $55,862 | 62.53% |
| 11226 | 344 | 600 | 100,277 | $52,052 | 57.33% |
| 11228 | 101 | 222 | 44,994 | $67,911 | 45.50% |
| 11229 | 316 | 640 | 83,615 | $60,873 | 49.38% |
| 11230 | 631 | 1046 | 89,075 | $49,541 | 60.33% |
| 11231 | 127 | 271 | 37,845 | $100,213 | 46.86% |
| 11232 | 85 | 150 | 27,602 | $56,661 | 56.67% |
| 11233 | 225 | 383 | 76,819 | $40,449 | 58.75% |
| 11234 | 364 | 713 | 95,666 | $81,399 | 51.05% |
| 11235 | 348 | 684 | 78,128 | $52,538 | 50.88% |
| 11236 | 416 | 701 | 100,331 | $67,669 | 59.34% |
| 11237 | 184 | 288 | 49,310 | $51,413 | 63.89% |
| 11238 | 183 | 350 | 54,540 | $85,407 | 52.29% |
| 11239 | 85 | 129 | 13,244 | $27,104 | 65.89% |
| 11357 | 162 | 320 | 39,902 | $83,951 | 50.63% |
| 11354 | 134 | 272 | 55,200 | $42,500 | 49.26% |
| 11355 | 213 | 364 | 80,853 | $39,207 | 58.52% |
| 11356 | 110 | 226 | 23,362 | $60,493 | 48.67% |
| 11358 | 119 | 248 | 37,190 | $66,129 | 47.98% |
| 11360 | 59 | 153 | 19,621 | $86,174 | 38.56% |
| 11361 | 85 | 188 | 27,246 | $85,887 | 45.21% |
| 11362 | 64 | 143 | 18,721 | $89,185 | 44.76% |
| 11363 | 27 | 65 | 6,952 | $104,792 | 41.54% |
| 11364 | 113 | 220 | 36,806 | $76,988 | 51.36% |
| 11365 | 166 | 312 | 44,983 | $66,483 | 53.21% |
| 11366 | 106 | 183 | 14,650 | $78,990 | 57.92% |
| 11367 | 318 | 511 | 41,824 | $57,933 | 62.23% |
| 11368 | 947 | 1227 | 112,425 | $50,797 | 77.18% |
| 11369 | 331 | 454 | 34,118 | $54,121 | 72.91% |
| 11370 | 378 | 777 | 32,514 | $65,098 | 48.65% |
| 11372 | 492 | 693 | 61,844 | $56,383 | 71.00% |
| 11373 | 831 | 1148 | 93,967 | $51,183 | 72.39% |
| 11374 | 319 | 535 | 42,653 | $63,161 | 59.63% |
| 11375 | 418 | 838 | 73,488 | $80,542 | 49.88% |
| 11377 | 364 | 628 | 86,421 | $57,010 | 57.96% |
| 11378 | 156 | 285 | 37,279 | $73,333 | 54.74% |
| 11379 | 195 | 360 | 37,851 | $82,819 | 54.17% |
| 11385 | 425 | 759 | 106,717 | $72,261 | 55.99% |
| 11411 | 151 | 221 | 20,759 | $93,882 | 68.33% |
| 11412 | 245 | 410 | 37,458 | $78,517 | 59.76% |
| 11413 | 261 | 432 | 42,443 | $86,324 | 60.42% |
| 11414 | 162 | 321 | 29,219 | $71,648 | 50.47% |
| 11415 | 149 | 243 | 19,372 | $68,294 | 61.32% |
| 11416 | 117 | 185 | 27,125 | $67,461 | 63.24% |
| 11417 | 173 | 291 | 31,927 | $73,424 | 59.45% |
| 11418 | 216 | 363 | 38,517 | $66,570 | 59.50% |
| 11419 | 182 | 334 | 49,618 | $70,882 | 54.49% |
| 11420 | 223 | 390 | 48,489 | $67,932 | 57.18% |
| 11421 | 202 | 352 | 41,002 | $72,066 | 57.39% |
| 11422 | 211 | 341 | 32,082 | $89,235 | 61.88% |
| 11423 | 164 | 270 | 31,400 | $70,266 | 60.74% |
| 11426 | 101 | 202 | 20,801 | $88,803 | 50.00% |
| 11427 | 181 | 323 | 24,037 | $74,581 | 56.04% |
| 11428 | 112 | 171 | 18,929 | $73,699 | 65.50% |
| 11434 | 358 | 555 | 65,791 | $62,207 | 64.50% |
| 11432 | 405 | 613 | 62,053 | $55,906 | 66.07% |
| 11433 | 155 | 250 | 36,489 | $51,521 | 62.00% |
| 11435 | 293 | 517 | 59,296 | $64,086 | 56.67% |
| 11436 | 100 | 155 | 20,077 | $75,242 | 64.52% |
| 11691 | 436 | 694 | 67,094 | $46,147 | 62.82% |
| 11692 | 110 | 184 | 20,991 | $44,024 | 59.78% |
| 11693 | 86 | 144 | 12,919 | $59,431 | 59.72% |
| 11694 | 143 | 270 | 21,354 | $80,976 | 52.96% |
| 11697 | 25 | 62 | 3,540 | $103,580 | 40.32% |
SOURCE: TRD analysis of Department of Health and US census data
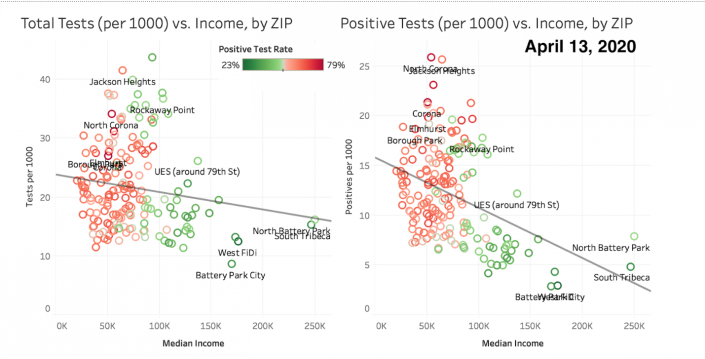
The second run of the analysis, on April 13, found that testing had accelerated most in lower-income ZIP codes. The positive-test rate also increased more dramatically in those neighborhoods, strengthening the inverse correlation between income and the rate of positive tests.
Coronavirus testing by zip code as of April 13th
| Zip Codes | Positive Tests | Total Tests | Population | Median Income | Positive Rate |
|---|---|---|---|---|---|
| 10001 | 211 | 448 | 22,924 | $88,526 | 47.10% |
| 10002 | 539 | 1024 | 74,993 | $35,859 | 52.64% |
| 10003 | 279 | 662 | 54,682 | $112,131 | 42.15% |
| 10004 | 23 | 59 | 3,028 | $157,645 | 38.98% |
| 10005 | 38 | 116 | 8,831 | $173,333 | 32.76% |
| 10006 | 10 | 43 | 3,454 | $176,250 | 23.26% |
| 10007 | 34 | 107 | 7,023 | $246,813 | 31.78% |
| 10009 | 381 | 851 | 57,925 | $61,548 | 44.77% |
| 10010 | 166 | 468 | 33,730 | $117,923 | 35.47% |
| 10011 | 355 | 731 | 50,472 | $128,613 | 48.56% |
| 10012 | 98 | 285 | 23,411 | $109,037 | 34.39% |
| 10013 | 161 | 362 | 28,709 | $105,442 | 44.48% |
| 10014 | 212 | 457 | 30,738 | $126,601 | 46.39% |
| 10016 | 435 | 992 | 51,057 | $117,004 | 43.85% |
| 10017 | 90 | 260 | 15,801 | $127,506 | 34.62% |
| 10018 | 156 | 331 | 9,687 | $108,914 | 47.13% |
| 10019 | 334 | 753 | 43,703 | $98,833 | 44.36% |
| 10021 | 386 | 967 | 46,215 | $118,289 | 39.92% |
| 10022 | 219 | 562 | 31,125 | $135,363 | 38.97% |
| 10023 | 341 | 857 | 62,435 | $130,452 | 39.79% |
| 10024 | 380 | 994 | 59,001 | $131,668 | 38.23% |
| 10025 | 626 | 1439 | 92,805 | $85,930 | 43.50% |
| 10026 | 308 | 605 | 39,363 | $58,884 | 50.91% |
| 10027 | 476 | 910 | 64,548 | $46,113 | 52.31% |
| 10028 | 317 | 802 | 47,793 | $125,140 | 39.53% |
| 10029 | 824 | 1538 | 79,597 | $34,016 | 53.58% |
| 10030 | 277 | 448 | 29,882 | $37,232 | 61.83% |
| 10031 | 611 | 935 | 60,254 | $49,891 | 65.35% |
| 10032 | 728 | 1190 | 64,264 | $50,391 | 61.18% |
| 10033 | 626 | 1011 | 59,607 | $58,614 | 61.92% |
| 10034 | 345 | 607 | 42,910 | $54,716 | 56.84% |
| 10035 | 440 | 796 | 35,743 | $30,081 | 55.28% |
| 10036 | 232 | 494 | 27,428 | $91,936 | 46.96% |
| 10037 | 232 | 405 | 21,139 | $45,041 | 57.28% |
| 10038 | 151 | 300 | 22,800 | $86,058 | 50.33% |
| 10039 | 266 | 478 | 27,726 | $39,653 | 55.65% |
| 10040 | 498 | 786 | 44,571 | $47,137 | 63.36% |
| 10065 | 216 | 627 | 28,109 | $127,375 | 34.45% |
| 10069 | 35 | 93 | 5,085 | $110,625 | 37.63% |
| 10075 | 262 | 564 | 21,556 | $137,146 | 46.45% |
| 10128 | 396 | 1006 | 59,256 | $114,010 | 39.36% |
| 10280 | 27 | 81 | 9,384 | $169,844 | 33.33% |
| 10282 | 44 | 90 | 5,593 | $250,001 | 48.89% |
| 10301 | 593 | 1133 | 38,733 | $55,802 | 52.34% |
| 10302 | 318 | 612 | 18,204 | $64,103 | 51.96% |
| 10303 | 486 | 866 | 25,947 | $62,558 | 56.12% |
| 10304 | 788 | 1529 | 41,064 | $52,199 | 51.54% |
| 10305 | 700 | 1504 | 42,298 | $76,489 | 46.54% |
| 10306 | 886 | 1989 | 53,142 | $79,569 | 44.55% |
| 10307 | 246 | 510 | 15,232 | $80,893 | 48.24% |
| 10308 | 430 | 984 | 30,186 | $93,963 | 43.70% |
| 10309 | 561 | 1264 | 33,531 | $103,175 | 44.38% |
| 10310 | 383 | 815 | 23,262 | $72,093 | 46.99% |
| 10312 | 1008 | 2071 | 61,741 | $95,064 | 48.67% |
| 10314 | 1569 | 3231 | 90,761 | $86,742 | 48.56% |
| 10451 | 788 | 1314 | 47,798 | $28,921 | 59.97% |
| 10452 | 1068 | 1640 | 76,078 | $28,277 | 65.12% |
| 10453 | 1146 | 1811 | 79,606 | $25,275 | 63.28% |
| 10454 | 550 | 872 | 38,203 | $21,149 | 63.07% |
| 10455 | 562 | 919 | 42,283 | $26,801 | 61.15% |
| 10456 | 1130 | 1840 | 94,218 | $27,106 | 61.41% |
| 10457 | 969 | 1551 | 74,554 | $27,420 | 62.48% |
| 10458 | 968 | 1662 | 83,960 | $33,932 | 58.24% |
| 10459 | 746 | 1201 | 48,351 | $27,687 | 62.11% |
| 10460 | 771 | 1288 | 59,505 | $26,866 | 59.86% |
| 10461 | 1018 | 1878 | 50,348 | $56,612 | 54.21% |
| 10462 | 1201 | 2158 | 76,756 | $52,409 | 55.65% |
| 10463 | 885 | 1810 | 71,360 | $58,551 | 48.90% |
| 10464 | 75 | 194 | 4,434 | $93,365 | 38.66% |
| 10465 | 865 | 1762 | 44,205 | $74,796 | 49.09% |
| 10466 | 1259 | 2112 | 72,479 | $51,477 | 59.61% |
| 10467 | 1769 | 2911 | 103,732 | $37,015 | 60.77% |
| 10468 | 1224 | 1849 | 78,647 | $36,046 | 66.20% |
| 10469 | 1514 | 2448 | 73,870 | $63,652 | 61.85% |
| 10470 | 258 | 472 | 15,432 | $57,160 | 54.66% |
| 10471 | 302 | 669 | 21,896 | $85,707 | 45.14% |
| 10472 | 918 | 1408 | 68,796 | $30,977 | 65.20% |
| 10473 | 1053 | 1795 | 59,609 | $41,638 | 58.66% |
| 10474 | 170 | 266 | 12,127 | $25,493 | 63.91% |
| 10475 | 912 | 1623 | 43,208 | $50,832 | 56.19% |
| 11004 | 324 | 505 | 15,234 | $92,657 | 64.16% |
| 11101 | 344 | 672 | 30,043 | $65,392 | 51.19% |
| 11102 | 306 | 534 | 30,800 | $64,067 | 57.30% |
| 11103 | 296 | 524 | 36,140 | $71,437 | 56.49% |
| 11104 | 264 | 429 | 26,119 | $61,269 | 61.54% |
| 11105 | 279 | 550 | 37,382 | $73,959 | 50.73% |
| 11106 | 342 | 629 | 38,363 | $63,703 | 54.37% |
| 11109 | 37 | 103 | 5,981 | $148,590 | 35.92% |
| 11201 | 373 | 894 | 62,823 | $124,996 | 41.72% |
| 11203 | 1001 | 1529 | 75,451 | $51,277 | 65.47% |
| 11204 | 1110 | 1791 | 76,978 | $49,785 | 61.98% |
| 11205 | 392 | 724 | 46,064 | $56,708 | 54.14% |
| 11206 | 757 | 1312 | 88,349 | $36,404 | 57.70% |
| 11207 | 928 | 1495 | 91,972 | $37,243 | 62.07% |
| 11208 | 1029 | 1568 | 98,660 | $40,733 | 65.63% |
| 11209 | 587 | 1162 | 67,809 | $72,314 | 50.52% |
| 11210 | 898 | 1427 | 67,040 | $65,900 | 62.93% |
| 11211 | 1202 | 1893 | 102,624 | $71,225 | 63.50% |
| 11212 | 842 | 1302 | 76,527 | $26,239 | 64.67% |
| 11213 | 793 | 1296 | 66,295 | $41,710 | 61.19% |
| 11214 | 760 | 1330 | 92,946 | $54,041 | 57.14% |
| 11215 | 350 | 797 | 70,156 | $123,583 | 43.91% |
| 11216 | 376 | 709 | 56,308 | $61,121 | 53.03% |
| 11217 | 316 | 599 | 41,407 | $107,362 | 52.75% |
| 11218 | 976 | 1606 | 74,508 | $69,415 | 60.77% |
| 11219 | 1679 | 2476 | 90,036 | $39,295 | 67.81% |
| 11220 | 784 | 1238 | 95,643 | $47,079 | 63.33% |
| 11221 | 641 | 1061 | 83,835 | $50,153 | 60.41% |
| 11222 | 255 | 518 | 36,492 | $85,111 | 49.23% |
| 11223 | 885 | 1555 | 81,789 | $50,108 | 56.91% |
| 11224 | 485 | 811 | 46,707 | $33,131 | 59.80% |
| 11225 | 632 | 1001 | 58,882 | $55,862 | 63.14% |
| 11226 | 995 | 1527 | 100,277 | $52,052 | 65.16% |
| 11228 | 356 | 626 | 44,994 | $67,911 | 56.87% |
| 11229 | 791 | 1402 | 83,615 | $60,873 | 56.42% |
| 11230 | 1301 | 2091 | 89,075 | $49,541 | 62.22% |
| 11231 | 241 | 504 | 37,845 | $100,213 | 47.82% |
| 11232 | 267 | 395 | 27,602 | $56,661 | 67.59% |
| 11233 | 591 | 971 | 76,819 | $40,449 | 60.87% |
| 11234 | 1149 | 1879 | 95,666 | $81,399 | 61.15% |
| 11235 | 911 | 1601 | 78,128 | $52,538 | 56.90% |
| 11236 | 1313 | 1985 | 100,331 | $67,669 | 66.15% |
| 11237 | 451 | 665 | 49,310 | $51,413 | 67.82% |
| 11238 | 448 | 778 | 54,540 | $85,407 | 57.58% |
| 11239 | 250 | 403 | 13,244 | $27,104 | 62.03% |
| 11354 | 461 | 757 | 55,200 | $42,500 | 60.90% |
| 11355 | 587 | 926 | 80,853 | $39,207 | 63.39% |
| 11356 | 285 | 497 | 23,362 | $60,493 | 57.34% |
| 11357 | 441 | 777 | 39,902 | $83,951 | 56.76% |
| 11358 | 289 | 553 | 37,190 | $66,129 | 52.26% |
| 11360 | 173 | 358 | 19,621 | $86,174 | 48.32% |
| 11361 | 253 | 463 | 27,246 | $85,887 | 54.64% |
| 11362 | 167 | 339 | 18,721 | $89,185 | 49.26% |
| 11363 | 68 | 136 | 6,952 | $104,792 | 50.00% |
| 11364 | 259 | 485 | 36,806 | $76,988 | 53.40% |
| 11365 | 440 | 791 | 44,983 | $66,483 | 55.63% |
| 11366 | 244 | 419 | 14,650 | $78,990 | 58.23% |
| 11367 | 591 | 1007 | 41,824 | $57,933 | 58.69% |
| 11368 | 2398 | 3035 | 112,425 | $50,797 | 79.01% |
| 11369 | 883 | 1165 | 34,118 | $54,121 | 75.79% |
| 11370 | 833 | 1348 | 32,514 | $65,098 | 61.80% |
| 11372 | 1428 | 1927 | 61,844 | $56,383 | 74.10% |
| 11373 | 1859 | 2600 | 93,967 | $51,183 | 71.50% |
| 11374 | 673 | 1169 | 42,653 | $63,161 | 57.57% |
| 11375 | 937 | 1741 | 73,488 | $80,542 | 53.82% |
| 11377 | 1152 | 1740 | 86,421 | $57,010 | 66.21% |
| 11378 | 397 | 679 | 37,279 | $73,333 | 58.47% |
| 11379 | 434 | 797 | 37,851 | $82,819 | 54.45% |
| 11385 | 1066 | 1797 | 106,717 | $72,261 | 59.32% |
| 11411 | 408 | 594 | 20,759 | $93,882 | 68.69% |
| 11412 | 693 | 1081 | 37,458 | $78,517 | 64.11% |
| 11413 | 752 | 1163 | 42,443 | $86,324 | 64.66% |
| 11414 | 453 | 765 | 29,219 | $71,648 | 59.22% |
| 11415 | 306 | 517 | 19,372 | $68,294 | 59.19% |
| 11416 | 317 | 489 | 27,125 | $67,461 | 64.83% |
| 11417 | 421 | 683 | 31,927 | $73,424 | 61.64% |
| 11418 | 532 | 838 | 38,517 | $66,570 | 63.48% |
| 11419 | 542 | 858 | 49,618 | $70,882 | 63.17% |
| 11420 | 675 | 1064 | 48,489 | $67,932 | 63.44% |
| 11421 | 602 | 906 | 41,002 | $72,066 | 66.45% |
| 11422 | 552 | 898 | 32,082 | $89,235 | 61.47% |
| 11423 | 486 | 745 | 31,400 | $70,266 | 65.23% |
| 11426 | 292 | 524 | 20,801 | $88,803 | 55.73% |
| 11427 | 440 | 726 | 24,037 | $74,581 | 60.61% |
| 11428 | 349 | 536 | 18,929 | $73,699 | 65.11% |
| 11429 | 536 | 765 | 27,403 | $83,240 | 70.07% |
| 11432 | 843 | 1304 | 62,053 | $55,906 | 64.65% |
| 11433 | 477 | 727 | 36,489 | $51,521 | 65.61% |
| 11434 | 1060 | 1655 | 65,791 | $62,207 | 64.05% |
| 11435 | 796 | 1308 | 59,296 | $64,086 | 60.86% |
| 11436 | 269 | 412 | 20,077 | $75,242 | 65.29% |
| 11691 | 1111 | 1647 | 67,094 | $46,147 | 67.46% |
| 11692 | 297 | 471 | 20,991 | $44,024 | 63.06% |
| 11693 | 197 | 334 | 12,919 | $59,431 | 58.98% |
| 11694 | 360 | 622 | 21,354 | $80,976 | 57.88% |
| 11697 | 63 | 130 | 3,540 | $103,580 | 48.46% |
SOURCE: TRD analysis of census and NYC Department of Health data
The tide of the epidemic in New York City may be turning as social distancing slows transmission of the virus. Hospitalization data shows that the number of people admitted to hospitals in the city for Covid-19, once as high as 700 per day, has declined to fewer than 400. If the number drops below 200 for 10 consecutive days it will be a sign that the spread is indeed slowing, according to the city’s Department of Health.